See how a report, a research equation and a client correction can become native slide objects. Download the decks, import them from your workspace’s Import menu, and edit the objects yourself.
These are authored demonstrations with illustrative data, not customer work or measured AI results. Downloads and previews are public; editing in the workspace requires the workspace subscription.
Turn a short report into a chart slide
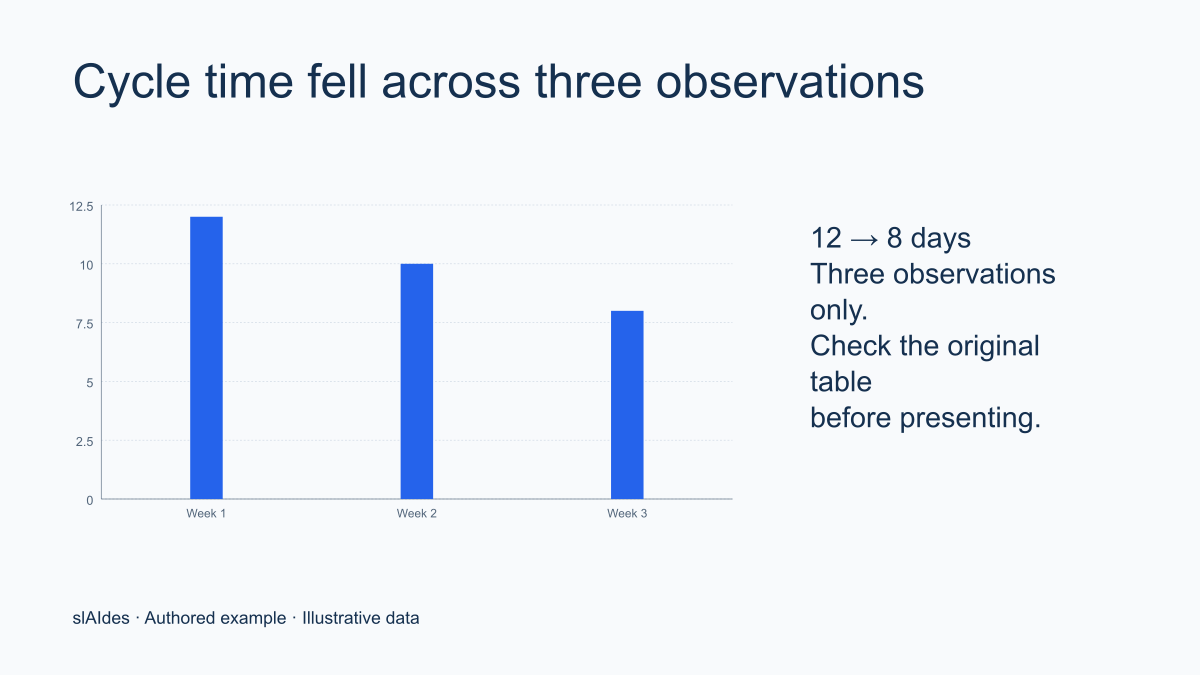
A three-week operations report becomes one chart and one explicit takeaway. The numbers remain inspectable in a native chart object.
Try this workflow
Download the source PDF and read its table and scope note.
In an AI draft, ask for one chart slide with the original units and a source note.
Compare every chart value with the report, then edit chart data and wording in the editor.
Scope and limits: This example was authored to demonstrate native objects. It is not a recorded AI conversion, and the three illustrative observations do not establish a causal improvement.
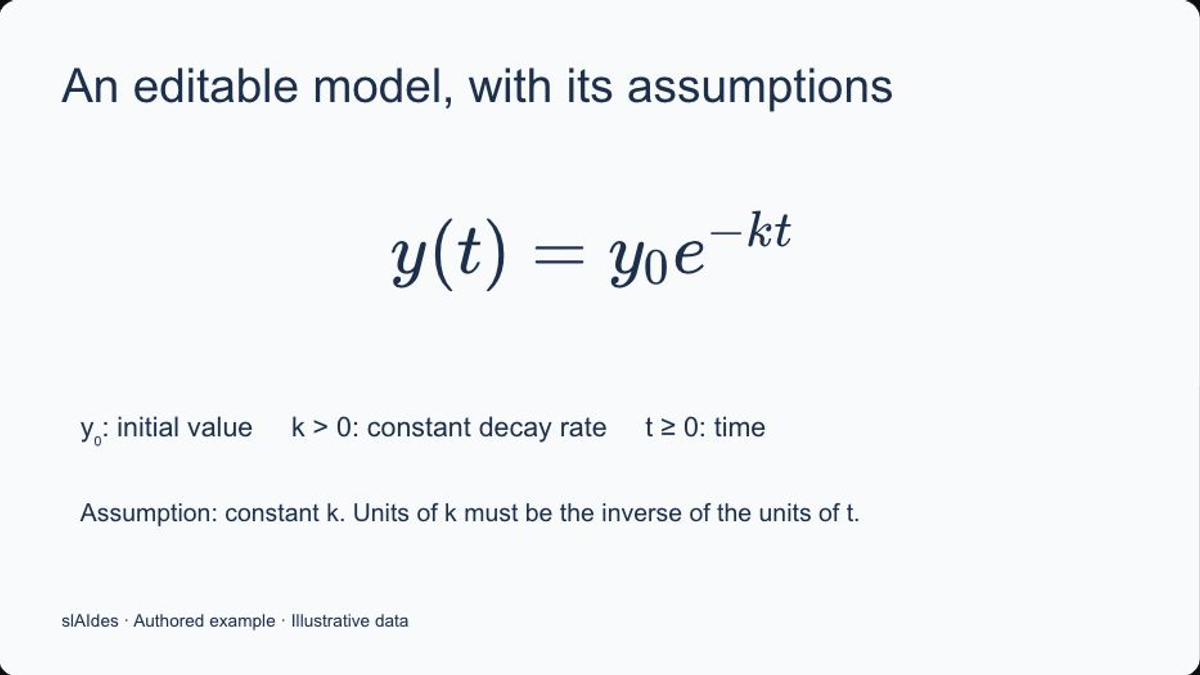
An exponential-decay model is a native LaTeX element alongside the assumptions needed to explain it. The notation can be corrected without replacing an image.
Try this workflow
Download and import the native example deck.
Select the equation and open its LaTeX editor; change the decay coefficient or notation.
Update the variable definitions and speaker notes so they agree with the new equation.
Scope and limits: This is a mathematical illustration, not a scientific result. Correct rendering does not verify a model's assumptions or its applicability to your research.
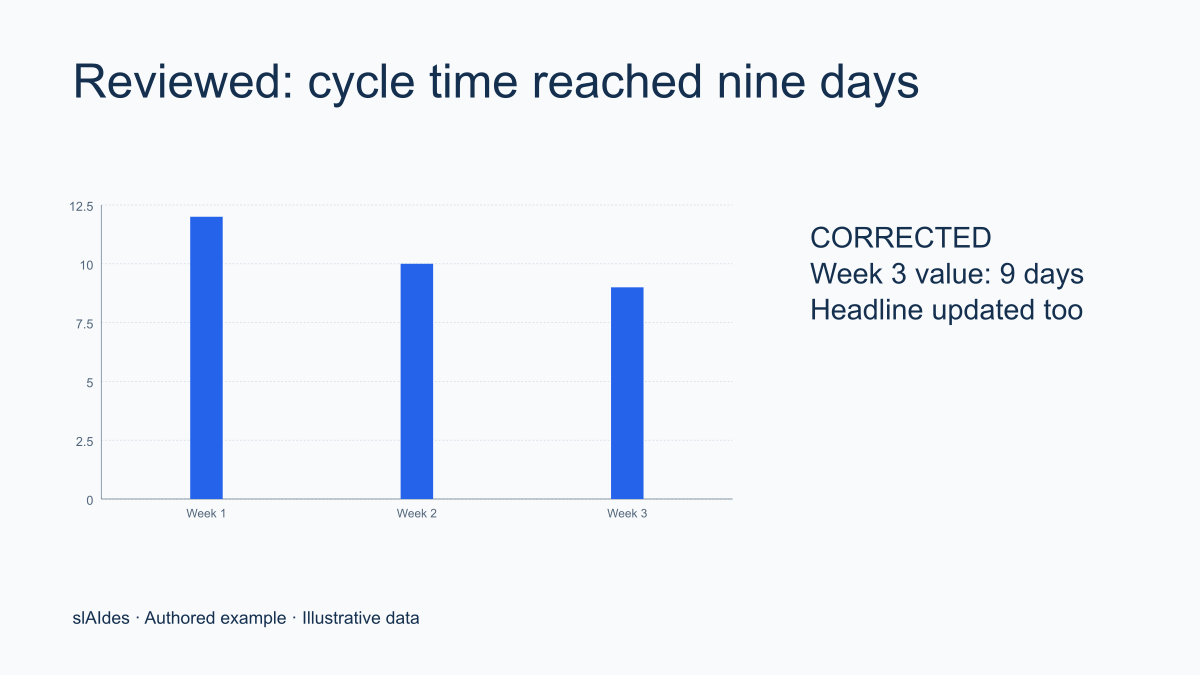
The second slide revises the third observation from eight to nine days. Both the chart and the headline change, preserving a clear review trail in the example deck.
Try this workflow
Import the two-slide deck and compare the draft with the corrected slide.
Edit the native chart data and its headline together when the client supplies a correction.
Review units, speaker notes and caveats, then share a read-only link or export the final deck.
Scope and limits: The two slides show an authored before-and-after example, not automatic detection of a data correction. Reviewers must check the final deck.
For published findings about presentation editing and slide generation, read our presentation research and statistics. Each finding links to its original study and states what was measured.